How To Make Performance Visible With GitLab CI And Hoodoo Of GitLab Artifacts
Anton Nemtsev
Performance degradation is a problem we face on a daily basis. We could put effort to make the application blazing fast, but we soon end up where we started. It’s happening because of new features being added and the fact that we sometimes don’t have a second thought on packages that we constantly add and update, or think about the complexity of our code. It’s generally a small thing, but it’s still all about the small things.
We can’t afford to have a slow app. Performance is a competitive advantage that can bring and retain customers. We can’t afford regularly spending time optimizing apps all over again. It’s costly, and complex. And that means that despite all of the benefits of performance from a business perspective, it’s hardly profitable. As a first step in coming up with a solution for any problem, we need to make the problem visible. This article will help you with exactly that.
Note: If you have a basic understanding of Node.js, a vague idea about how your CI/CD works, and care about the performance of the app or business advantages it can bring, then we are good to go.
How To Create A Performance Budget For A Project
The first questions we should ask ourselves are:
“What is the performant project?”
“Which metrics should I use?”
“Which values of these metrics are acceptable?”
The metrics selection is outside of the scope of this article and depends highly on the project context, but I recommend that you start by reading User-centric Performance Metrics by Philip Walton.
From my perspective, it’s a good idea to use the size of the library in kilobytes as a metric for the npm package. Why? Well, it’s because if other people are including your code in their projects, they would perhaps want to minimize the impact of your code on their application’s final size.
For the site, I would consider Time To First Byte (TTFB) as a metric. This metric shows how much time it takes for the server to respond with something. This metric is important, but quite vague because it can include anything — starting from server rendering time and ending up with latency problems. So it’s nice to use it in conjunction with Server Timing or OpenTracing to find out what it exactly consists of.
You should also consider such metrics as Time to Interactive (TTI) and First Meaningful Paint (the latter will soon be replaced with Largest Contentful Paint (LCP)). I think both of these are most important — from the perspective of perceived performance.
But bear in mind: metrics are always context-related, so please don’t just take this for granted. Think about what is important in your specific case.
The easiest way to define desired values for metrics is to use your competitors — or even yourself. Also, from time to time, tools such as Performance Budget Calculator may come handy — just play around with it a little.
Performance degradation is a problem we face daily. We could put effort to make the application blazing fast, but soon we end up where we started.
“
Use Competitors For Your Benefit
If you ever happened to run away from an ecstatically overexcited bear, then you already know, that you don’t need to be an Olympic champion in running to get out of this trouble. You just need to be a little bit faster than the other guy.
So make a competitors list. If these are projects of the same type, then they usually consist of page types similar to each other. For example, for an internet shop, it may be a page with a product list, product details page, shopping cart, checkout, and so on.
- Measure the values of your selected metrics on each type of page for your competitor’s projects;
- Measure the same metrics on your project;
- Find the closest better than your value for each metric in the competitor’s projects. Adding 20% to them and set as your next goals.
Why 20%? This is a magic number that supposedly means the difference will be noticeable to the bare eye. You can read more about this number in Denys Mishunov’s article “Why Perceived Performance Matters, Part 1: The Perception Of Time”.
A Fight With A Shadow
Do you have a unique project? Don’t have any competitors? Or you are already better than any of them in all possible senses? It’s not an issue. You can always compete with the only worthy opponent, i.e. yourself. Measure each performance metric of your project on each type of page and then make them better by the same 20%.
Synthetic Tests
There are two ways of measuring performance:
- Synthetic (in a controlled environment)
- RUM (Real User Measurements)
Data is being collected from real users in production.
In this article, we will use synthetic tests and assume that our project uses GitLab with its built-in CI for project deployment.
Library And Its Size As A Metric
Let’s assume that you’ve decided to develop a library and publish it to NPM. You want to keep it light — much lighter than competitors — so it has less impact on the resulting project’s end size. This saves clients traffic — sometimes traffic which the client is paying for. It also allows the project to be loaded faster, which is pretty important in regards to the growing mobile share and new markets with slow connection speeds and fragmented internet coverage.
Package For Measuring Library Size
To keep the size of the library as small as possible, we need to carefully watch how it changes over development time. But how can you do it? Well, we could use package Size Limit created by Andrey Sitnik from Evil Martians.
Let’s install it.
npm i -D size-limit @size-limit/preset-small-lib
Then, add it to package.json.
"scripts": {
+ "size": "size-limit",
  "test": "jest && eslint ."
},
+ "size-limit": [
+   {
+     "path": "index.js"
+   }
+ ],
The "size-limit":[{},{},…] block contains a list of the size of the files of which we want to check. In our case, it’s just one single file: index.js.
NPM script size just runs the size-limit package, which reads the configuration block size-limit mentioned before and checks the size of the files listed there. Let’s run it and see what happens:
npm run size
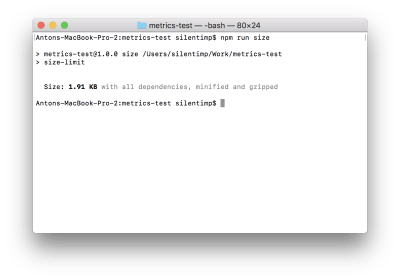
We can see the size of the file, but this size is not actually under control. Let’s fix that by adding limit to package.json:
"size-limit": [
  {
+   "limit": "2 KB",
    "path": "index.js"
  }
],
Now if we run the script it will be validated against the limit we set.
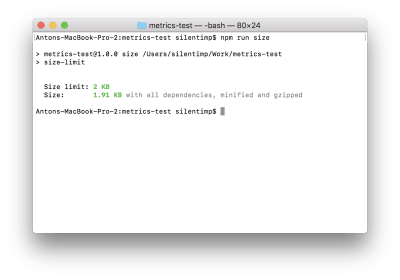
In the case that new development changes the file size to the point of exceeding the defined limit, the script will complete with non-zero code. This, aside from other things, means that it will stop the pipeline in the GitLab CI.
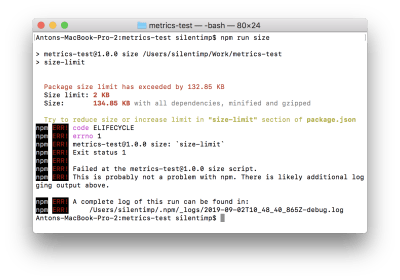
Now we can use git hook to check the file size against the limit before every commit. We may even use the husky package to make it in a nice and simple way.
Let’s install it.
npm i -D husky
Then, modify our package.json.
"size-limit": [
  {
    "limit": "2 KB",
    "path": "index.js"
  }
],
+  "husky": {
+    "hooks": {
+      "pre-commit": "npm run size"
+    }
+  },
And now before each commit automatically would be executed npm run size command and if it will end with non-zero code then commit would never happen.
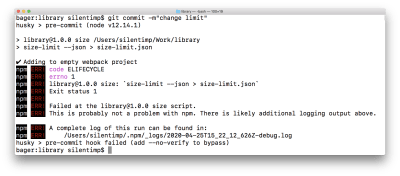
But there are many ways to skip hooks (intentionally or even by accident), so we shouldn’t rely on them too much.
Also, it’s important to note that we shouldn’t need to make this check blocking. Why? Because it’s okay that the size of the library grows while you are adding new features. We need to make the changes visible, that’s all. This will help to avoid an accidental size increase because of introducing a helper library that we don’t need. And, perhaps, give developers and product owners a reason to consider whether the feature being added is worth the size increase. Or, maybe, whether there are smaller alternative packages. Bundlephobia allows us to find an alternative for almost any NPM package.
So what should we do? Let’s show the change in the file size directly in the merge request! But you don’t push to master directly; you act like a grown-up developer, right?
Running Our Check On GitLab CI
Let’s add a GitLab artifact of the metrics type. An artifact is a file, which will «live» after the pipeline operation is finished. This specific type of artifact allows us to show an additional widget in the merge request, showing any change in the value of the metric between artifact in the master and the feature branch. The format of the metrics artifact is a text Prometheus format. For GitLab values inside the artifact, it’s just text. GitLab doesn’t understand what it is that has exactly changed in the value — it just knows that the value is different. So, what exactly should we do?
- Define artifacts in the pipeline.
- Change the script so that it creates an artifact on the pipeline.
To create an artifact we need to change .gitlab-ci.yml this way:
image: node:latest

stages:
  - performance

sizecheck:
  stage: performance
  before_script:
    - npm ci
  script:
    - npm run size
+  artifacts:
+    expire_in: 7 days
+    paths:
+      - metric.txt
+    reports:
+      metrics: metric.txt
expire_in: 7 days— artifact will exist for 7 days.-
paths:
  metric.txt
It will be saved in the root catalog. If you skip this option then it wouldn’t be possible to download it.
-
reports:
  metrics: metric.txt
The artifact will have the type
reports:metrics
Now let’s make Size Limit generate a report. To do so we need to change package.json:
"scripts": {
-  "size": "size-limit",
+  "size": "size-limit --json > size-limit.json",
  "test": "jest && eslint ."
},
size-limit with key --json will output data in json format:
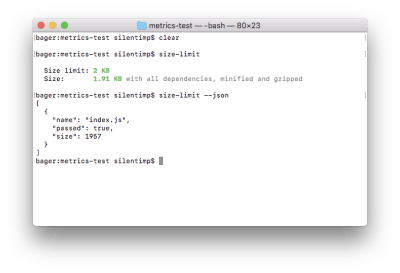
size-limit --json output JSON to console. JSON contains an array of objects which contain a file name and size, as well as lets us know if it exceeds the size limit. (Large preview)
And redirection > size-limit.json will save JSON into file size-limit.json.
Now we need to create an artifact out of this. Format boils down to [metrics name][space][metrics value]. Let’s create the script generate-metric.js:
const report = require('./size-limit.json');
process.stdout.write(`size ${(report[0].size/1024).toFixed(1)}Kb`);
process.exit(0);
And add it to package.json:
"scripts": {
  "size": "size-limit --json > size-limit.json",
+  "postsize": "node generate-metric.js > metric.txt",
  "test": "jest && eslint ."
},
Because we have used the post prefix, the npm run size command will run the size script first, and then, automatically, execute the postsize script, which will result in the creation of the metric.txt file, our artifact.
As a result, when we merge this branch to master, change something and create a new merge request, we will see the following:
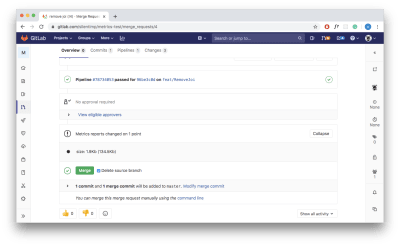
In the widget that appears on the page we, first, see the name of the metric (size) followed by the value of the metric in the feature branch as well as the value in the master within the round brackets.
Now we can actually see how to change the size of the package and make a reasonable decision whether we should merge it or not.
- You may see all this code in this repository.
Resume
OK! So, we’ve figured out how to handle the trivial case. If you have multiple files, just separate metrics with line breaks. As an alternative for Size Limit, you may consider bundlesize. If you are using WebPack, you may get all sizes you need by building with the --profile and --json flags:
webpack --profile --json > stats.json
If you are using next.js, you can use the @next/bundle-analyzer plugin. It’s up to you!
Using Lighthouse
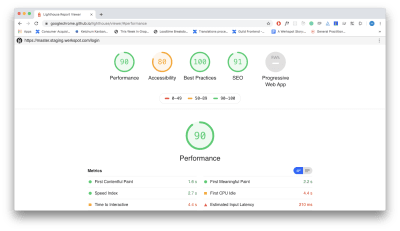
Lighthouse is the de facto standard in project analytics. Let’s write a script that allows us to measure performance, a11y, best practices, and provide us with an SEO score.
Script To Measure All The Stuff
To start, we need to install the lighthouse package which will make measurements. We also need to install puppeteer which we will be using as a headless-browser.
npm i -D lighthouse puppeteer
Next, let’s create a lighthouse.js script and start our browser:
const puppeteer = require('puppeteer');

(async () => {
  const browser = await puppeteer.launch({
    args: ['--no-sandbox', '--disable-setuid-sandbox', '--headless'],
  });
})();
Now let’s write a function that will help us analyze a given URL:
const lighthouse = require('lighthouse');
const DOMAIN = process.env.DOMAIN;

const buildReport = browser => async url => {
  const data = await lighthouse(
    `${DOMAIN}${url}`,
    {
      port: new URL(browser.wsEndpoint()).port,
      output: 'json',
    },
    {
      extends: 'lighthouse:full',
    }
  );
  const { report: reportJSON } = data;
  const report = JSON.parse(reportJSON);
  // …
}
Great! We now have a function that will accept the browser object as an argument and return a function that will accept URL as an argument and generate a report after passing that URL to the lighthouse.
We are passing the following arguments to the lighthouse:
- The address we want to analyze;
lighthouseoptions, browserportin particular, andoutput(output format of the report);reportconfiguration andlighthouse:full(all we can measure). For more precise configuration, check the documentation.
Wonderful! We now have our report. But what we can do with it? Well, we can check the metrics against the limits and exit script with non-zero code which will stop the pipeline:
if (report.categories.performance.score But we just want to make performance visible and non-blocking? Then let’s adopt another artifact type: GitLab performance artifact.
GitLab Performance Artifact
In order to understand this artifacts format, we have to read the code of the sitespeed.io plugin. (Why can’t GitLab describe the format of their artifacts inside their own documentation? Mystery.)
[
  {
    "subject":"/",
    "metrics":[
      {
        "name":"Transfer Size (KB)",
        "value":"19.5",
        "desiredSize":"smaller"
      },
      {
        "name":"Total Score",
        "value":92,
        "desiredSize":"larger"
      },
      {…}
    ]
    },
  {…}
]
An artifact is a JSON file that contains an array of the objects. Each of them represents a report about one URL.
[{page 1}, {page 2}, …]
Each page is represented by an object with the next attributes:
subject
Page identifier (it’s quite handy to use such a pathname);metrics
An array of the objects (each of them represents one measurement that was made on the page).
{
  "subject":"/login/",
  "metrics":[{measurement 1}, {measurement 2}, {measurement 3}, …]
}
A measurement is an object that contains the following attributes:
name
Measurement name, e.g. it may beTime to first byteorTime to interactive.value
Numeric measurement result.desiredSize
If target value should be as small as possible, e.g. for theTime to interactivemetric, then the value should besmaller. If it should be as large as possible, e.g. for the lighthousePerformance score, then uselarger.
{
  "name":"Time to first byte (ms)",
  "value":240,
  "desiredSize":"smaller"
}
Let’s modify our buildReport function in a way that it returns a report for one page with standard lighthouse metrics.
const buildReport = browser => async url => {
  // …

  const metrics = [
    {
      name: report.categories.performance.title,
      value: report.categories.performance.score,
      desiredSize: 'larger',
    },
    {
      name: report.categories.accessibility.title,
      value: report.categories.accessibility.score,
      desiredSize: 'larger',
    },
    {
      name: report.categories['best-practices'].title,
      value: report.categories['best-practices'].score,
      desiredSize: 'larger',
    },
    {
      name: report.categories.seo.title,
      value: report.categories.seo.score,
      desiredSize: 'larger',
    },
    {
      name: report.categories.pwa.title,
      value: report.categories.pwa.score,
      desiredSize: 'larger',
    },
  ];
  return {
    subject: url,
    metrics: metrics,
  };
}
Now, when we have a function that generates a report. Let’s apply it to each type of the pages of the project. First, I need to state that process.env.DOMAIN should contain a staging domain (to which you need to deploy your project from a feature branch beforehand).
+ const fs = require('fs');
const lighthouse = require('lighthouse');
const puppeteer = require('puppeteer');
const DOMAIN = process.env.DOMAIN;
const buildReport = browser => async url => {/* … */};

+ const urls = [
+   '/inloggen',
+   '/wachtwoord-herstellen-otp',
+   '/lp/service',
+   '/send-request-to/ww-tammer',
+   '/post-service-request/binnenschilderwerk',
+ ];

(async () => {
  const browser = await puppeteer.launch({
    args: ['--no-sandbox', '--disable-setuid-sandbox', '--headless'],
  });
+   const builder = buildReport(browser);
+   const report = [];
+   for (let url of urls) {
+     const metrics = await builder(url);
+     report.push(metrics);
+   }
+   fs.writeFileSync(`./performance.json`, JSON.stringify(report));
+   await browser.close();
})();
- You can find the full source in this gist and working example in this repository.
Note: At this point, you may want to interrupt me and scream in vain, “Why are you taking up my time — you can’t even use Promise.all properly!” In my defense, I dare say, that it is not recommended to run more than one lighthouse instance at the same time because this adversely affects the accuracy of the measurement results. Also, if you do not show due ingenuity, it will lead to an exception.
Use Of Multiple Processes
Are you still into parallel measurements? Fine, you may want to use node cluster (or even Worker Threads if you like playing bold), but it makes sense to discuss it only in the case when your pipeline running on the environment with multiple available cors. And even then, you should keep in mind that because of the Node.js nature you will have full-weight Node.js instance spawned in each process fork ( instead of reusing the same one which will lead to growing RAM consumption). All of this means that it will be more costly because of the growing hardware requirement and a little bit faster. It may appear that the game is not worth the candle.
If you want to take that risk, you will need to:
- Split the URL array to chunks by cores number;
- Create a fork of a process according to the number of the cores;
- Transfer parts of the array to the forks and then retrieve generated reports.
To split an array, you can use multpile approaches. The following code — written in just a couple of minutes — wouldn’t be any worse than the others:
/**
 * Returns urls array splited to chunks accordin to cors number
 *
 * @param urls {String[]} — URLs array
 * @param cors {Number} — count of available cors
 * @return {Array} — URLs array splited to chunks
 */
function chunkArray(urls, cors) {
  const chunks = [...Array(cors)].map(() => []);
  let index = 0;
  urls.forEach((url) => {
    if (index > (chunks.length - 1)) {
      index = 0;
    }
    chunks[index].push(url);
    index += 1;
  });
  return chunks;
}
Make forks according to cores count:
// Adding packages that allow us to use cluster
const cluster = require('cluster');
// And find out how many cors are available. Both packages are build-in for node.js.
const numCPUs = require('os').cpus().length;

(async () => {
  if (cluster.isMaster) {
    // Parent process
    const chunks = chunkArray(urls, urls.length/numCPUs);
    chunks.map(chunk => {
      // Creating child processes
      const worker = cluster.fork();
    });
  } else {
    // Child process
  }
})();
Let’s transfer an array of chunks to child processes and retrive reports back:
(async () => {
  if (cluster.isMaster) {
    // Parent process
    const chunks = chunkArray(urls, urls.length/numCPUs);
    chunks.map(chunk => {
      const worker = cluster.fork();
+       // Send message with URL’s array to child process
+       worker.send(chunk);
    });
  } else {
    // Child process
+     // Recieveing message from parent proccess
+     process.on('message', async (urls) => {
+       const browser = await puppeteer.launch({
+         args: ['--no-sandbox', '--disable-setuid-sandbox', '--headless'],
+       });
+       const builder = buildReport(browser);
+       const report = [];
+       for (let url of urls) {
+         // Generating report for each URL
+         const metrics = await builder(url);
+         report.push(metrics);
+       }
+       // Send array of reports back to the parent proccess
+       cluster.worker.send(report);
+       await browser.close();
+     });
  }
})();
And, finally, reassemble reports to one array and generate an artifact.
- Check out the full code and repository with an example that shows how to use lighthouse with multiple processes.
Accuracy Of Measurements
Well, we parallelized the measurements, which increased the already unfortunate large measurement error of the lighthouse. But how do we reduce it? Well, make a few measurements and calculate the average.
To do so, we will write a function that will calculate the average between current measurement results and previous ones.
// Count of measurements we want to make
const MEASURES_COUNT = 3;

/*
 * Reducer which will calculate an avarage value of all page measurements
 * @param pages {Object} — accumulator
 * @param page {Object} — page
 * @return {Object} — page with avarage metrics values
 */
const mergeMetrics = (pages, page) => {
  if (!pages) return page;
  return {
    subject: pages.subject,
    metrics: pages.metrics.map((measure, index) => {
      let value = (measure.value + page.metrics[index].value)/2;
      value = +value.toFixed(2);
      return {
        ...measure,
        value,
      }
    }),
  }
}
Then, change our code to use them:
    process.on('message', async (urls) => {
      const browser = await puppeteer.launch({
        args: ['--no-sandbox', '--disable-setuid-sandbox', '--headless'],
      });
      const builder = buildReport(browser);
      const report = [];
      for (let url of urls) {
+       // Let’s measure MEASURES_COUNT times and calculate the avarage
+       let measures = [];
+       let index = MEASURES_COUNT;
+       while(index--){
          const metric = await builder(url);
+         measures.push(metric);
+       }
+       const measure = measures.reduce(mergeMetrics);
        report.push(measure);
      }
      cluster.worker.send(report);
      await browser.close();
    });
  }
- Check out the gist with the full code and repository with an example.
And now we can add lighthouse into the pipeline.
Adding It To The Pipeline
First, create a configuration file named .gitlab-ci.yml.
image: node:latest

stages:
    # You need to deploy a project to staging and put the staging domain name
    # into the environment variable DOMAIN. But this is beyond the scope of this article,
    # primarily because it is very dependent on your specific project.
    # - deploy
    # - performance

lighthouse:
    stage: performance
  before_script:
    - apt-get update
    - apt-get -y install gconf-service libasound2 libatk1.0-0 libatk-bridge2.0-0 libc6
    libcairo2 libcups2 libdbus-1-3 libexpat1 libfontconfig1 libgcc1 libgconf-2-4
    libgdk-pixbuf2.0-0 libglib2.0-0 libgtk-3-0 libnspr4 libpango-1.0-0 libpangocairo-1.0-0
    libstdc++6 libx11-6 libx11-xcb1 libxcb1 libxcomposite1 libxcursor1 libxdamage1 libxext6
    libxfixes3 libxi6 libxrandr2 libxrender1 libxss1 libxtst6 ca-certificates fonts-liberation
    libappindicator1 libnss3 lsb-release xdg-utils wget
    - npm ci
  script:
      - node lighthouse.js
    artifacts:
    expire_in: 7 days
    paths:
        - performance.json
    reports:
        performance: performance.json
The multiple installed packages are needed for the puppeteer. As an alternative, you may consider using docker. Aside from that, it makes sense to the fact that we set the type of artifact as performance. And, as soon as both master and feature branch will have it, you will see a widget like this in the merge request:
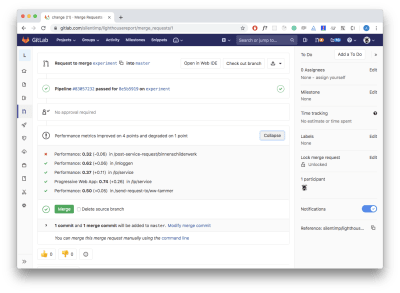
Nice?
Resume
We are finally done with a more complex case. Obviously, there are multiple similar tools aside from the lighthouse. For example, sitespeed.io. GitLab documentation even contains an article that explains how to use sitespeed in the GitLab’s pipeline. There is also a plugin for GitLab that allows us to generate an artifact. But who would prefer community-driven open-source products to the one owned by a corporate monster?
Ain’t No Rest For The Wicked
It may seem that we’re finally there, but no, not yet. If you are using a paid GitLab version, then artifacts with report types metrics and performance are present in the plans starting from premium and silver which cost $19 per month for each user. Also, you can’t just buy a specific feature you need — you can only change the plan. Sorry. So what we can do? In distinction from GitHub with its Checks API and Status API, GitLab wouldn’t allow you to create an actual widget in the merge request yourself. And there is no hope to get them anytime soon.

One way to check whether you actually have support for these features: You can search for the environment variable GITLAB_FEATURES in the pipeline. If it lacks merge_request_performance_metrics and metrics_reports in the list, then this features are not supported.
GITLAB_FEATURES=audit_events,burndown_charts,code_owners,contribution_analytics,
elastic_search, export_issues,group_bulk_edit,group_burndown_charts,group_webhooks,
issuable_default_templates,issue_board_focus_mode,issue_weights,jenkins_integration,
ldap_group_sync,member_lock,merge_request_approvers,multiple_issue_assignees,
multiple_ldap_servers,multiple_merge_request_assignees,protected_refs_for_users,
push_rules,related_issues,repository_mirrors,repository_size_limit,scoped_issue_board,
usage_quotas,visual_review_app,wip_limits
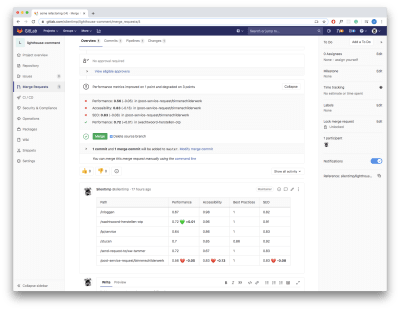
If there is no support, we need to come up with something. For example, we may add a comment to the merge request, comment with the table, containing all the data we need. We can leave our code untouched — artifacts will be created, but widgets will always show a message «metrics are unchanged».
Very strange and non-obvious behavior; I had to think carefully to understand what was happening.
So, what’s the plan?
- We need to read artifact from the
masterbranch; - Create a comment in the
markdownformat; - Get the identifier of the merge request from the current feature branch to the master;
- Add the comment.
How To Read Artifact From The Master Branch
If we want to show how performance metrics are changed between master and feature branches, we need to read artifact from the master. And to do so, we will need to use fetch.
npm i -S isomorphic-fetch
// You can use predefined CI environment variables
// @see https://gitlab.com/help/ci/variables/predefined_variables.md

// We need fetch polyfill for node.js
const fetch = require('isomorphic-fetch');

// GitLab domain
const GITLAB_DOMAIN = process.env.CI_SERVER_HOST || process.env.GITLAB_DOMAIN || 'gitlab.com';
// User or organization name
const NAME_SPACE = process.env.CI_PROJECT_NAMESPACE || process.env.PROJECT_NAMESPACE || 'silentimp';
// Repo name
const PROJECT = process.env.CI_PROJECT_NAME || process.env.PROJECT_NAME || 'lighthouse-comments';
// Name of the job, which create an artifact
const JOB_NAME = process.env.CI_JOB_NAME || process.env.JOB_NAME || 'lighthouse';

/*
 * Returns an artifact
 *
 * @param name {String} - artifact file name
 * @return {Object} - object with performance artifact
 * @throw {Error} - thhrow an error, if artifact contain string, that can’t be parsed as a JSON. Or in case of fetch errors.
 */
const getArtifact = async name => {
  const response = await fetch(`https://${GITLAB_DOMAIN}/${NAME_SPACE}/${PROJECT}/-/jobs/artifacts/master/raw/${name}?job=${JOB_NAME}`);
  if (!response.ok) throw new Error('Artifact not found');
  const data = await response.json();
  return data;
};
Creating A Comment Text
We need to build comment text in the markdown format. Let’s create some service funcions that will help us:
/**
 * Return part of report for specific page
 *
 * @param report {Object} — report
 * @param subject {String} — subject, that allow find specific page
 * @return {Object} — page report
 */
const getPage = (report, subject) => report.find(item => (item.subject === subject));

/**
 * Return specific metric for the page
 *
 * @param page {Object} — page
 * @param name {String} — metrics name
 * @return {Object} — metric
 */
const getMetric = (page, name) => page.metrics.find(item => item.name === name);

/**
 * Return table cell for desired metric
 *
 * @param branch {Object} - report from feature branch
 * @param master {Object} - report from master branch
 * @param name {String} - metrics name
 */
const buildCell = (branch, master, name) => {
  const branchMetric = getMetric(branch, name);
  const masterMetric = getMetric(master, name);
  const branchValue = branchMetric.value;
  const masterValue = masterMetric.value;
  const desiredLarger = branchMetric.desiredSize === 'larger';
  const isChanged = branchValue !== masterValue;
  const larger = branchValue > masterValue;
  if (!isChanged) return `${branchValue}`;
  if (larger) return `${branchValue} ${desiredLarger ? '💚' : '💔' } **+${Math.abs(branchValue - masterValue).toFixed(2)}**`;
  return `${branchValue} ${!desiredLarger ? '💚' : '💔' } **-${Math.abs(branchValue - masterValue).toFixed(2)}**`;
};

/**
 * Returns text of the comment with table inside
 * This table contain changes in all metrics
 *
 * @param branch {Object} report from feature branch
 * @param master {Object} report from master branch
 * @return {String} comment markdown
 */
const buildCommentText = (branch, master) =>{
  const md = branch.map( page => {
    const pageAtMaster = getPage(master, page.subject);
    if (!pageAtMaster) return '';
    const md = `|${page.subject}|${buildCell(page, pageAtMaster, 'Performance')}|${buildCell(page, pageAtMaster, 'Accessibility')}|${buildCell(page, pageAtMaster, 'Best Practices')}|${buildCell(page, pageAtMaster, 'SEO')}|
`;
    return md;
  }).join('');
  return `
|Path|Performance|Accessibility|Best Practices|SEO|
|--- |--- |--- |--- |--- |
${md}
`;
};
Script Which Will Build A Comment
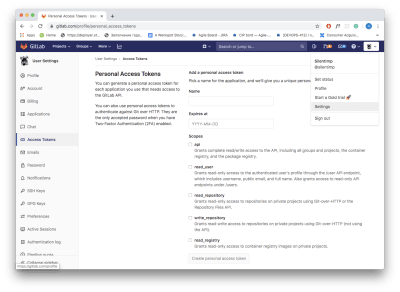
You will need to have a token to work with GitLab API. In order to generate one, you need to open GitLab, log in, open the ‘Settings’ option of the menu, and then open ‘Access Tokens’ found on the left side of the navigation menu. You should then be able to see the form, which allows you to generate the token.
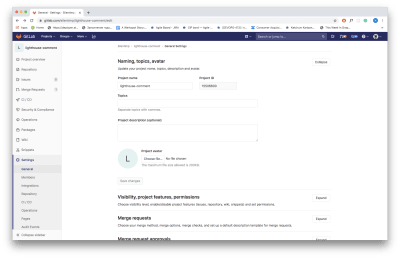
Also, you will need an ID of the project. You can find it in the repository ‘Settings’ (in the submenu ‘General’):
To add a comment to the merge request, we need to know its ID. Function that allows you to acquire merge request ID looks like this:
// You can set environment variables via CI/CD UI.
// @see https://gitlab.com/help/ci/variables/README#variables
// I have set GITLAB_TOKEN this way

// ID of the project
const GITLAB_PROJECT_ID = process.env.CI_PROJECT_ID || '18090019';
// Token
const TOKEN = process.env.GITLAB_TOKEN;

/**
 * Returns iid of the merge request from feature branch to master
 * @param from {String} — name of the feature branch
 * @param to {String} — name of the master branch
 * @return {Number} — iid of the merge request
 */
const getMRID = async (from, to) => {
  const response = await fetch(`https://${GITLAB_DOMAIN}/api/v4/projects/${GITLAB_PROJECT_ID}/merge_requests?target_branch=${to}&source_branch=${from}`, {
    method: 'GET',
    headers: {
      'PRIVATE-TOKEN': TOKEN,
    }
  });
  if (!response.ok) throw new Error('Merge request not found');
  const [{iid}] = await response.json();
  return iid;
};
We need to get a feature branch name. You may use the environment variable CI_COMMIT_REF_SLUG inside the pipeline. Outside of the pipeline, you can use the current-git-branch package. Also, you will need to form a message body.
Let’s install the packages we need for this matter:
npm i -S current-git-branch form-data
And now, finally, function to add a comment:
const FormData = require('form-data');
const branchName = require('current-git-branch');

// Branch from which we are making merge request
// In the pipeline we have environment variable `CI_COMMIT_REF_NAME`,
// which contains name of this banch. Function `branchName`
// will return something like «HEAD detached» message in the pipeline.
// And name of the branch outside of pipeline
const CURRENT_BRANCH = process.env.CI_COMMIT_REF_NAME || branchName();

// Merge request target branch, usually it’s master
const DEFAULT_BRANCH = process.env.CI_DEFAULT_BRANCH || 'master';

/**
 * Adding comment to merege request
 * @param md {String} — markdown text of the comment
 */
const addComment = async md => {
  const iid = await getMRID(CURRENT_BRANCH, DEFAULT_BRANCH);
  const commentPath = `https://${GITLAB_DOMAIN}/api/v4/projects/${GITLAB_PROJECT_ID}/merge_requests/${iid}/notes`;
  const body = new FormData();
  body.append('body', md);

  await fetch(commentPath, {
    method: 'POST',
    headers: {
      'PRIVATE-TOKEN': TOKEN,
    },
    body,
  });
};
And now we can generate and add a comment:
    cluster.on('message', (worker, msg) => {
      report = [...report, ...msg];
      worker.disconnect();
      reportsCount++;
      if (reportsCount === chunks.length) {
        fs.writeFileSync(`./performance.json`, JSON.stringify(report));

+       if (CURRENT_BRANCH === DEFAULT_BRANCH) process.exit(0);
+       try {
+         const masterReport = await getArtifact('performance.json');
+         const md = buildCommentText(report, masterReport)
+         await addComment(md);
+       } catch (error) {
+         console.log(error);
+       }

        process.exit(0);
      }
    });
- Check the gist and demo repository.
Now create a merge request and you will get:
Resume
Comments are much less visible than widgets but it’s still much better than nothing. This way we can visualize the performance even without artifacts.
Authentication
OK, but what about authentication? The performance of the pages that require authentication is also important. It’s easy: we will simply log in. puppeteer is essentially a fully-fledged browser and we can write scripts that mimic user actions:
const LOGIN_URL = '/login';
const USER_EMAIL = process.env.USER_EMAIL;
const USER_PASSWORD = process.env.USER_PASSWORD;

/**
 * Authentication sctipt
 * @param browser {Object} — browser instance
 */
const login = async browser => {
  const page = await browser.newPage();
  page.setCacheEnabled(false);
  await page.goto(`${DOMAIN}${LOGIN_URL}`, { waitUntil: 'networkidle2' });
  await page.click('input[name=email]');
  await page.keyboard.type(USER_EMAIL);
  await page.click('input[name=password]');
  await page.keyboard.type(USER_PASSWORD);
  await page.click('button[data-testid="submit"]', { waitUntil: 'domcontentloaded' });
};
Before checking a page that requires authentication, we may just run this script. Done.
Summary
In this way, I built the performance monitoring system at Werkspot — a company I currently work for. It’s great when you have the opportunity to experiment with the bleeding edge technology.
Now you also know how to visualize performance change, and it’s sure to help you better track performance degradation. But what comes next? You can save the data and visualize it for a time period in order to better understand the big picture, and you can collect performance data directly from the users.
You may also check out a great talk on this subject: “Measuring Real User Performance In The Browser.” When you build the system that will collect performance data and visualize them, it will help to find your performance bottlenecks and resolve them. Good luck with that!

(ra, il)